Parametric vs Graphic EQ: Which Should You Use?
- The practical difference
- What does a graphic EQ control?
- What does a parametric EQ control?
- Compare the two control models
- When is graphic EQ the better choice?
- When is parametric EQ the better choice?
- What does Q mean in practice?
- A ten-minute comparison drill
- Use the analyzer as evidence, not authority
- Keep the listening level safe
- A buying or setup checklist
The practical difference
A graphic EQ gives you a row of fixed frequency bands and a gain control for each one. A parametric EQ lets you choose a band’s center frequency, gain, and width, usually expressed as Q. Choose graphic EQ for quick, repeatable broad shaping on familiar fixed controls. Choose parametric EQ when you need to aim between those fixed bands, change how wide the adjustment is, or solve a specific tonal problem precisely.
Neither type is automatically more musical. The useful equalizer is the one that gives you enough control to make a verified improvement without turning the interface into the main event.
What does a graphic EQ control?
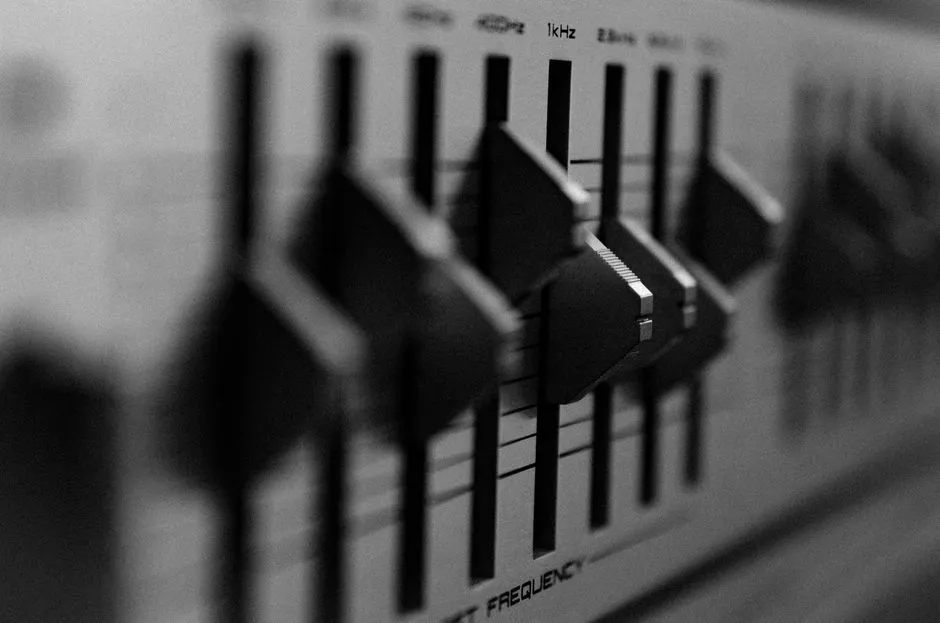
A graphic equalizer divides the spectrum into predetermined bands. Each slider or on-screen control raises or lowers the level around its labelled frequency. The band centers and bandwidth behavior come from the device or software design; the listener mainly chooses gain.
Adobe’s current Audition equalizer documentation describes its graphic EQ as using preset frequency bands and offers 10-, 20-, and 30-band intervals. It notes the central tradeoff: fewer bands make adjustment faster, while more bands provide greater precision.
That tradeoff applies beyond one product. A small car-stereo EQ may expose only a handful of broad bands. A rack or software graphic EQ may provide many narrow, regularly spaced bands. “Graphic EQ” identifies the fixed-band approach, not one mandatory number of sliders.
The layout is called graphic because the slider positions form a rough picture of the tonal curve. Treat that picture as a control summary, not a photograph of what arrives at your ears. Neighboring filters interact, the implementation matters, and the room, speaker, headphone, recording, and playback level all remain part of the result.
What does a parametric EQ control?
A parametric band commonly exposes three decisions:
- Frequency: where the adjustment is centered.
- Gain: how much that region is boosted or cut.
- Q or bandwidth: how narrow or broad the affected region is.
Apple’s Logic Pro Channel EQ documentation describes its parametric bands in exactly those terms: frequency sets the center, Q sets the width around that center, and gain sets the band’s level. A particular plug-in may label width differently or couple its behavior to gain, so read the manual instead of assuming the same number means the same curve everywhere.
Many parametric equalizers also include high-pass, low-pass, and shelving filters. Those are different shapes living in the same interface. A peaking or bell band changes a region around a center frequency. A shelf changes the range above or below its transition. A pass filter attenuates one side of a cutoff. The control labels tell you which problem the band is built to address.
Compare the two control models
| Question | Graphic EQ | Parametric EQ |
|---|---|---|
| Can you choose any center frequency? | Usually no; centers are fixed | Yes, within the control’s range |
| Can you set the affected width? | Usually fixed by the design | Usually adjustable with Q or bandwidth |
| Main strength | Fast broad shaping and recall | Precise placement and variable width |
| Main limitation | The wanted frequency may fall between bands | More variables make careless changes easier |
| Easiest first move | Change one nearby slider slightly | Use one broad bell with a small gain change |
| Best display habit | Read the labels, then listen | Read the values, then listen |
A 31-band graphic EQ can be more precise than a simple three-band parametric EQ in some tasks. A flexible parametric EQ can place a band more exactly than a graphic interface with many sliders. Count is not the whole comparison; the available frequency, gain, bandwidth, filter-shape, and bypass controls matter.
When is graphic EQ the better choice?
Use a graphic EQ when the task benefits from speed, fixed landmarks, and easy visual recall.
A familiar playback system. If the same set of bands appears every day in a car, music app, or venue rack, small repeatable adjustments may be easier than opening a detailed plug-in.
Broad preference shaping. A slight change across one or two neighboring bands can be enough when the goal is simply a little less upper-mid presence or a little more low-frequency weight.
Teaching frequency regions. Fixed labeled bands make a useful listening exercise. Move one control at a time, keep the change modest, and note which sounds are affected. Our guide to EQ frequency bands gives approximate listening anchors without pretending instruments live in one frequency box.
Fast comparison. A row of sliders can be reset and reproduced easily if the device provides clear values or detents. Photographing a hardware setting can preserve a starting point, although a picture is not a substitute for written values when precision matters.
Do not draw a smooth smile or frown simply because the controls invite it. Begin flat, name the problem, change the smallest relevant area, and bypass the result.
When is parametric EQ the better choice?
Use a parametric EQ when the fixed-band locations or widths are too restrictive.
A narrow, identifiable resonance. A movable bell or notch can target a specific frequency without changing as much neighboring material. Adobe warns that boosting an extremely narrow band can create ringing or resonance, so a narrow sweep used to locate a problem should not become the final boost.
A broad tonal imbalance. Low Q means a broader bell in many common implementations. That can make a gentle change feel less conspicuous than a narrow peak. Confirm the control behavior in the actual manual.
A transition rather than a center. Shelves and pass filters are more direct when the intent concerns everything above or below a boundary. Do not substitute a steep filter for a gentle shelf just because both curves lean in the same direction.
Repeatable editing. Exact frequency, gain, and Q values can be written down and recalled within the same equalizer. They are not guaranteed to translate identically to a different plug-in, hardware unit, source, or listening system.
Finding the real problem. A parametric EQ makes it possible to test whether the annoyance is narrow, broad, or somewhere else entirely. It also makes it possible to spend twenty minutes polishing a graph while the wrong track is selected. Bypass remains the adult in the room.
What does Q mean in practice?
Q relates a filter’s center frequency to its bandwidth. In ordinary peaking-EQ use, a higher Q generally means a narrower affected region, while a lower Q means a broader one. Some interfaces show bandwidth instead, and some filter types use or display Q differently.
Use your ears and the displayed curve together:
- Start with a broad band and a small cut or boost.
- Move the center slowly until the change addresses the named problem.
- Narrow the band only if too much neighboring sound is changing.
- Reduce the gain again after finding the region.
- Compare against bypass at a matched perceived level.
That fourth step matters. A large temporary boost can help reveal a region, but the listening boost is a searchlight, not a recommended final setting. Lower it before judging tone.
Q is not a quality score. A value of 10 is not “better” than a value of 1; it describes a different filter width in that implementation.
A ten-minute comparison drill
Use one well-known, full-range recording and one playback system. Turn off other tone controls, loudness enhancement, spatial processing, and automatic EQ if the system allows it. Save the flat state.
Minutes 1-2: establish the reference. Listen at a comfortable, moderate level. Write one neutral observation, such as “vocal consonants feel forward” or “bass notes obscure the kick attack.” Avoid “bad” and “better” until a comparison exists.
Minutes 3-4: graphic test. Choose the fixed band nearest the suspected region. Make one small cut. Bypass it twice, switching every few seconds, and record what changes besides the target.
Minutes 5-7: parametric test. Reset to flat. Use one broad parametric band at the same general region and make a similarly small cut. Move the center slightly in each direction. Keep Q broad unless the problem clearly occupies a narrow range.
Minutes 8-9: match level. Cuts and boosts can change apparent loudness. Adjust output only enough to keep the comparison fair, using meters where available and ears for the final perceived match.
Minute 10: choose or reset. Keep the version that solves the named problem with fewer unwanted changes. If neither reliably wins when bypassed, return to flat. A zero-setting conclusion is valid evidence.
Our guide to comparing EQ settings expands the level-matching, switching, and note-taking method. The listening lab collects exercises that put the ear ahead of the curve display.
Use the analyzer as evidence, not authority
A spectrum analyzer can show signal energy across frequency, but it does not know your intention. A visible peak may belong to a wanted note, consonant, drum transient, or room interaction. Cutting every peak can flatten the life out of a recording while producing an extremely tidy screenshot.
Apple’s Channel EQ includes a real-time FFT analyzer and allows pre- or post-EQ views. That makes the display useful for observing what the filter changes. It does not turn the analyzer into an automatic mix decision.
Use this order:
- describe what you hear;
- locate a plausible region;
- make one controlled change;
- compare against bypass;
- inspect the display to understand, document, or challenge the result.
If the visual curve changes your preference, hide the analyzer and repeat the comparison.
Keep the listening level safe
Do not raise playback level to make small EQ differences easier to hear. Louder often sounds more impressive in a short comparison, and excessive exposure can damage hearing.
The World Health Organization’s current safe-listening guidance explains that risk depends on both sound level and duration. It gives 80 dB for up to 40 hours per week as an example and 90 dB for only four hours per week, recommends keeping personal-device volume no higher than 60% of maximum, and advises breaks and exposure monitoring.
Those figures are exposure guidance, not calibration for an unknown volume slider. If a device provides reliable sound-dose monitoring, use it. Stop and seek a hearing professional if ringing, muffled hearing, pain, or hearing difficulty persists. EQ practice should happen at a level that does not require recovery.
A buying or setup checklist
Before choosing an EQ type, ask:
- Does the task need fixed broad shaping or movable frequency control?
- How many bands can operate at once?
- Can gain values be entered precisely and reset to zero?
- Does the parametric option provide Q or bandwidth control?
- Which shelves and pass filters are included?
- Is there a global bypass and an output-level control?
- Can settings be saved, named, copied, and compared?
- Does the manual explain filter shapes and slopes?
- Can the display or analyzer be hidden during a blind comparison?
- Does the device preserve separate settings for different outputs?
Choose the simplest tool that answers the actual need. Graphic EQ is not the beginner version of a parametric EQ, and parametric EQ is not a prestige upgrade. They are different maps of the same territory: one marks the stops in advance; the other lets you choose where to get off.
Browse sound basics for the rest of the equalizer vocabulary.