Waveform vs Spectrogram: Choose the Useful View
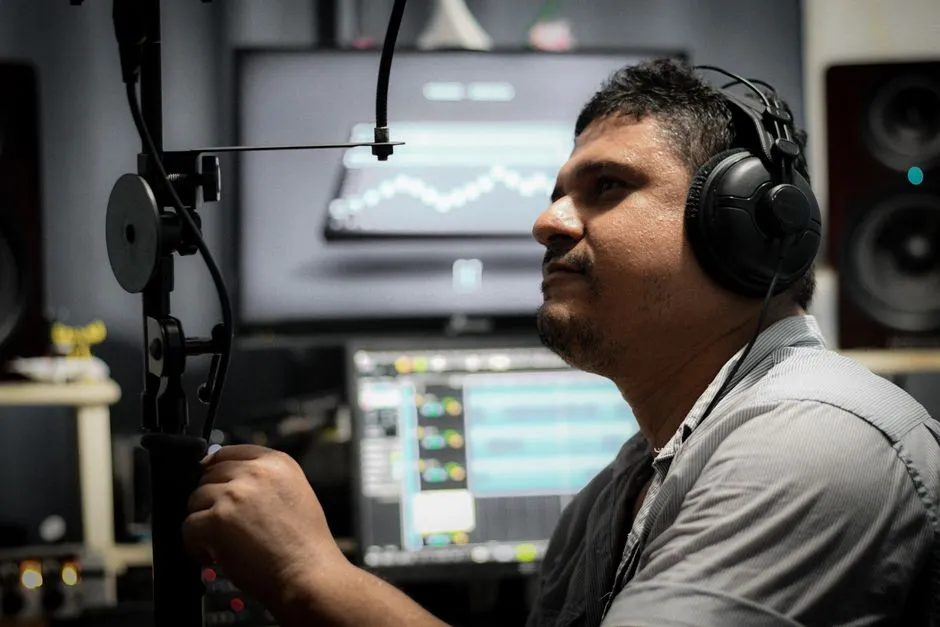
Should you use a waveform or a spectrogram?
A waveform shows amplitude over time; a spectrogram shows frequency content over time, with color representing intensity. Choose the display that answers your question, then record its settings. Neither picture establishes a safe listening level. Keep playback low, stop for hearing symptoms and seek professional advice; sudden hearing loss needs immediate medical attention. The exercise below can be completed without playing audio.
A useful display helps you ask a more precise question. It does not have to resemble a particularly dramatic mountain range before it deserves your attention.
What do the axes show?
Adobe's display guide identifies time on the horizontal axis of both views. The waveform's vertical axis represents amplitude; the spectral display's represents frequency. Its colors represent the amplitude of frequency components. Read the actual rulers before interpreting a shape.
| Question | Useful starting view | What to inspect |
|---|---|---|
| Where does the signal's amplitude change? | Waveform | Time and amplitude rulers |
| Which frequency regions appear during a passage? | Spectrogram | Time, frequency and color scale |
| Why did this screenshot change color? | Display settings | Palette and display gain |
| Is the listening level safe? | Neither image settles this | Assess actual sound exposure separately |
These are starting points for reading, not automatic editing instructions. Our dBFS and dB SPL guide explains why a digital display and an acoustic measurement are different records.
Why can the same audio look different?
Audacity's spectral-display preferences separate analysis settings, frequency scale and range, and the palette and gain used for color. The manual explicitly says those settings change how the track is drawn, not its audio. A changed picture therefore needs a settings check before an audio-change claim.
For this comparison, write down the application, version, channel and selected passage. Keep the same file and passage while changing the view. Do not add an effect, move a clip or replace the source halfway through and then attribute every difference to the display.
If someone supplies only a cropped picture, ask for the missing context. An attractive image without its rulers gives you less to work with than an ordinary one with readable labels.
Does a sharper display always reveal more?
Not in every respect. Audacity's spectrogram explanation describes a tradeoff between time and frequency resolution. Its illustrated example separates nearby clicks with a smaller analysis window, while a larger window better separates frequency detail but merges the clicks visually. An analysis window is the block used for that part of the calculation, not the application window on your desktop.
Our practical response is to record the setting that produced an observation. If a feature looks different after changing it, keep both observations with their settings. Do not quietly replace the first image and describe the second as an independent confirmation.
This guide is about choosing and annotating views. It does not supply a universal analysis-window size or a procedure for identifying a recording's source.
Can you complete this fictional reading exercise?
Imagine an editor sends two screenshots of a recording named Practice A. The screenshots cover the interval from 1:20 to 1:26. One contains a visible change at 1:23; the other uses a different color palette. These details are invented for the exercise, not observations from an audio test.
Begin with an evidence card:
| Field | Given information | Still needed |
|---|---|---|
| Recording | Practice A | File identity and version |
| Interval | 1:20 to 1:26 | Confirmation that both views use it |
| Marked location | 1:23 | Channel and relevant display labels |
| Difference | Another palette | Other settings changed, if any |
| Proposed explanation | None supplied | Evidence beyond the screenshot |
The interval lasts six seconds: 86 minus 80 equals 6. The mark lies three seconds after its start. Those calculations establish locations, not the cause of the feature.
Write a narrow caption: “Feature marked at 1:23; source and cause unconfirmed.” Do not turn it into “a faulty cable makes a click” when nobody has supplied that evidence. Likewise, do not call the second screenshot a repaired recording merely because it looks different.
Next, ask the editor to identify which details the comparison is meant to show. If the question is whether an edit removed a particular event, you need the actual before-and-after files and a documented change, not two unrelated pictures. Keep the original material available for comparison and work on a copy when editing is appropriate.
What should you keep with a useful screenshot?
Use a filename that identifies the project, passage and view. Put the application version and settings in a short accompanying note. Include enough of the rulers to let another reader locate the feature. Record “unknown” for missing information instead of supplying a likely value.
Separate three lines in that note: what is visible, what you think it might mean, and what would check that interpretation. This is our editorial recordkeeping method. It is not a forensic authentication protocol or a claim that visual analysis can recover missing context.
If the next task is changing tone, our graphic versus parametric EQ guide explains those controls separately. Finish the display-reading question before reaching for a filter.
What takes priority if you also listen?
A visual exercise does not require playback or test tones. If you listen, keep the level low and reduce exposure rather than turning up to investigate a faint detail. NIDCD explains that harmful sound can damage hearing and recommends hearing testing when loss is suspected. Stop for ringing, muffled hearing or discomfort and seek appropriate professional advice.
Sudden hearing loss is a medical emergency: seek immediate medical attention. Do not wait for a different display, EQ setting or listening comparison to explain it.